Help Center · Slide Types
Chart
One setup window for a bar, line, or pie chart.
Chart is one slide for a bar chart, a line chart, or a pie chart. There is no separate row for Line Chart or Pie Chart. Those are the Line and Pie choices inside this window. Older decks may still store a line or pie as its own type. You edit them here.
Where to find it
More slide types → Chart, unless you have pinned it. The window is Create Chart.
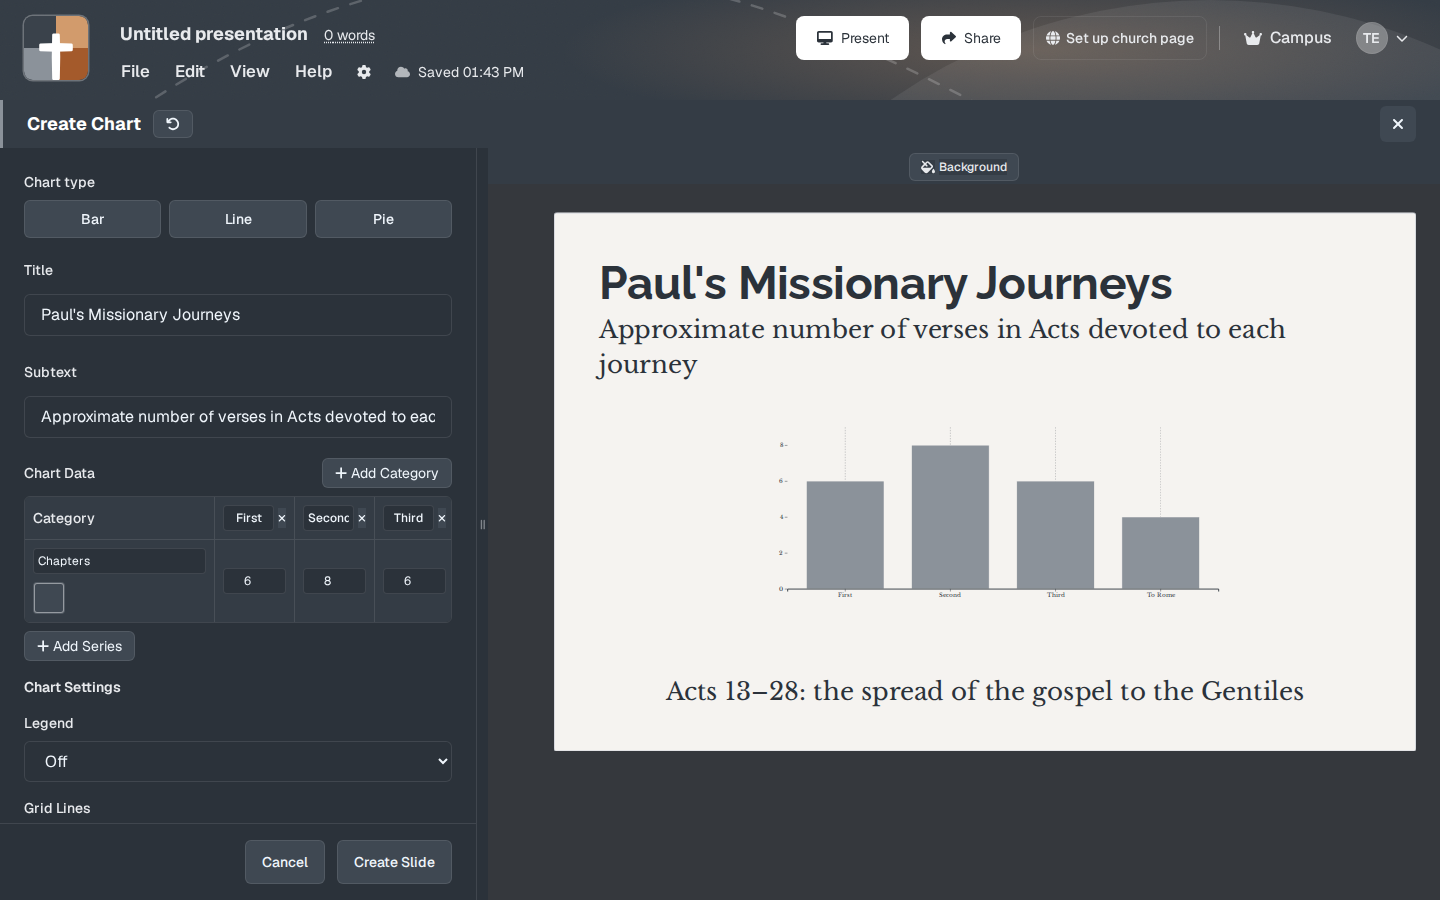
The setup window
- Chart type — Bar, Line, or Pie. The sample opens on Bar.
- Title — the sample is “Paul's Missionary Journeys.” Size starts at 65%.
- Subtext — the sample is “Approximate number of verses in Acts devoted to each journey.” Size starts at 70%.
- Chart Data — Add Category for each label along the chart (the sample categories are First, Second, Third, and To Rome). Add Series when you need more than one set of bars or lines.
- Legend — Off or On.
- Grid Lines — None, Vertical, Horizontal, or Both.
- Axis Lines — None, Horizontal, Vertical, or Both.
- Tickmarks.
- Column/Bar Padding and Group Padding — how tight the bars sit. The sample starts at 10.
- Chart Label Font.
- Text Under Chart — a line under the whole figure. The sample repeats the Acts 13–28 sentence. Size starts at 70%.
- Background, Create Slide, Cancel.
Replace the sample journey data. A chart that still says “Paul's Missionary Journeys” on a sermon about Nehemiah will be believed.
While you present
Bar compares amounts. Line shows a change across time. Pie shows parts of one whole, and it gets hard to read past a handful of slices. Read the title, then one comparison (“the third journey gets more verses than the first”), and stop. The chart does not need a tour of every number.
Plans
Chart is on the Free plan. Choosing Line or Pie does not change the plan. Free limits after the trial: 7 slides, 3 presentations, watermark.
See also Line Chart and Pie Chart.